
Table of Contents
The traceroute command is an indispensable network diagnostic tool that reveals the exact path your data takes across the internet. While ping tells you if a destination is reachable, traceroute shows you every step of the journey, making it essential for advanced network troubleshooting and performance analysis.
Whether you’re dealing with slow connections, intermittent network issues, or need to identify where packets are being dropped, understanding how to use the traceroute command effectively can transform your network troubleshooting capabilities.
In this comprehensive guide, we’ll explore everything about the traceroute command, from basic syntax to advanced analysis techniques across different operating systems. If you haven’t mastered the basics of network connectivity testing yet, start with our complete ping command guide before diving into traceroute.
What is Traceroute Command and How Does It Work?
The traceroute command (tracert on Windows) is a network diagnostic utility that maps the route packets take from your computer to a destination host. Unlike ping, which only tells you if a destination is reachable, traceroute reveals every router or gateway your data passes through on its journey across the network.
According to the Internet Engineering Task Force (IETF) RFC 1393, traceroute works by sending packets with incrementally increasing Time-To-Live (TTL) values, causing each router along the path to return an ICMP “Time Exceeded” message, effectively mapping the network route.
How Traceroute Command Works Step-by-Step
- First Packet: Sent with TTL=1, expires at the first router
- Router Response: First router sends back “Time Exceeded” message
- Second Packet: Sent with TTL=2, reaches second router before expiring
- Process Continues: TTL increments until destination is reached
- Complete Path: All intermediate hops are revealed
The term “traceroute” literally describes what it does – it traces the route your data takes through the network infrastructure.
Traceroute Command Syntax Across Operating Systems
Windows Tracert Command
tracert [destination]
Mac and Linux Traceroute Command
traceroute [destination]
Where [destination] can be:
- Domain name (e.g., google.com)
- IP address (e.g., 8.8.8.8)
- Hostname (e.g., mail.company.com)
How to Use Traceroute Command on Different Systems
Windows Tracert Command
To run traceroute on Windows:
- Press Windows + R to open Run dialog
- Type
cmdand press Enter to open Command Prompt - Type
tracert [destination]and press Enter - Wait for the trace to complete and analyze results
Example:
tracert google.com
Windows tracert uses ICMP echo requests by default and typically shows up to 30 hops before timing out.
Mac Traceroute Command
On macOS systems:
- Open Terminal from Applications > Utilities
- Type
traceroute [destination]and press Enter - Use Ctrl + C to stop if needed
Example:
traceroute google.com
Linux Traceroute Command
For Linux distributions:
- Open Terminal (Ctrl + Alt + T)
- Type
traceroute [destination]and press Enter - Install if needed:
sudo apt-get install traceroute
Advanced Linux options:
traceroute -I google.com    # Use ICMP instead of UDP
traceroute -T google.com    # Use TCP packets
Understanding Traceroute Command Output
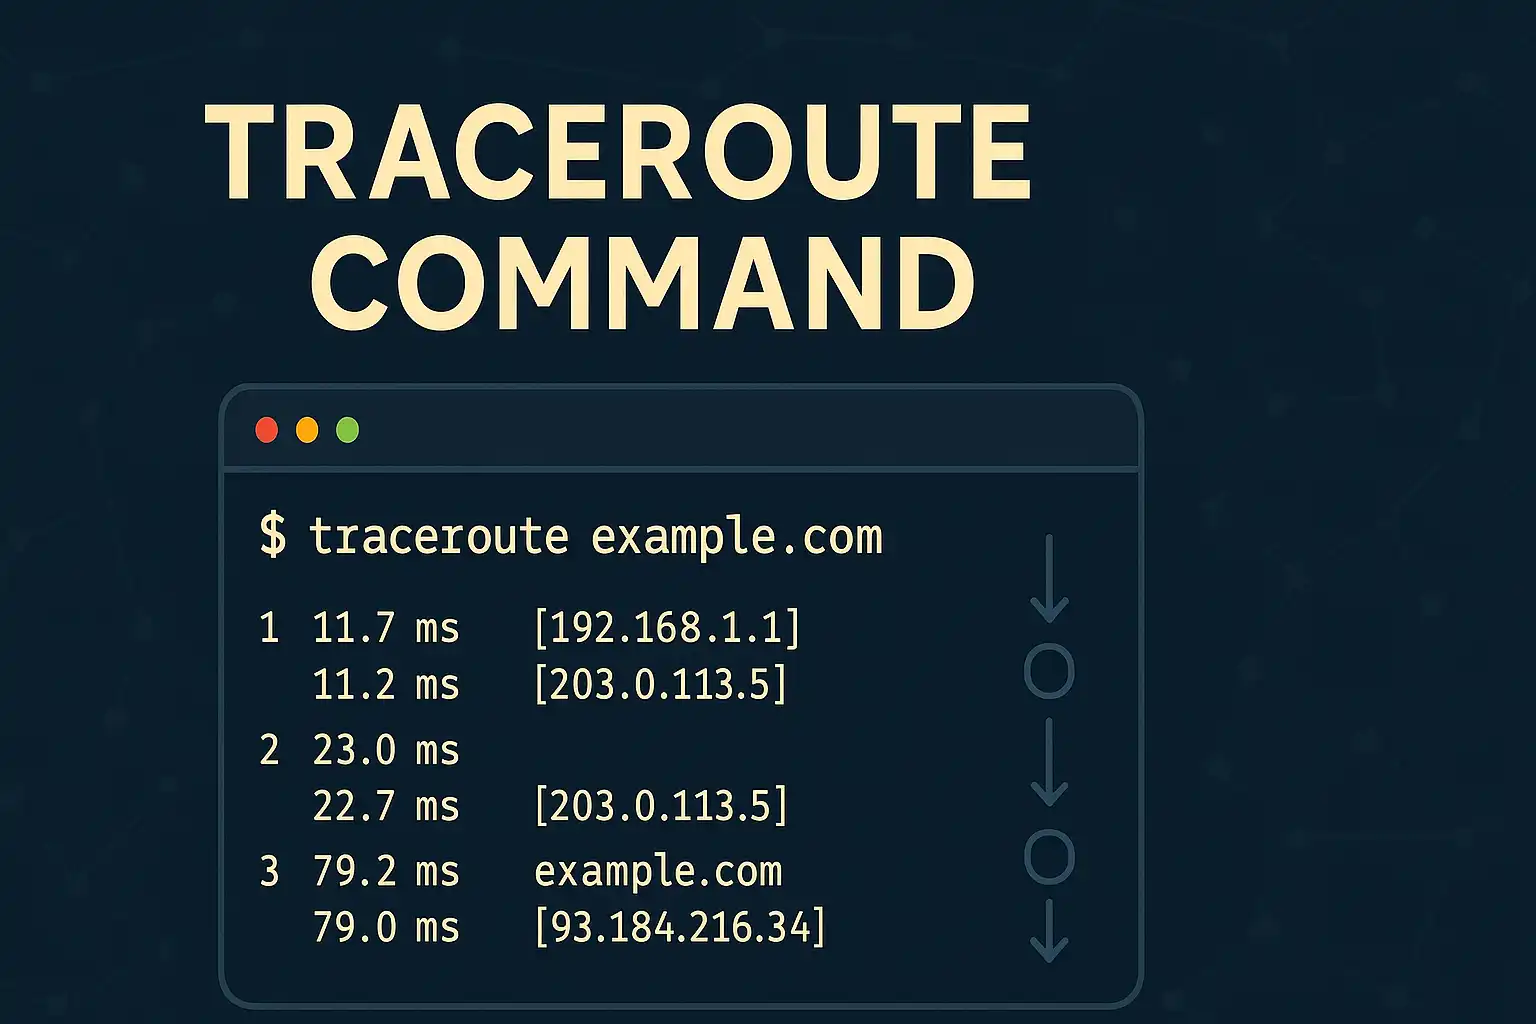
When you run a traceroute command, you’ll see detailed information about each network hop:
Reading Traceroute Results
A typical traceroute output shows:
- Hop Number: Sequential number for each router
- Router Name/IP: Hostname and IP address of each hop
- Response Times: Three timing measurements (usually in milliseconds)
- Asterisks (*): Indicate timeouts or filtered responses
Example Output:
1  router.local (192.168.1.1)  1.234 ms  1.456 ms  1.123 ms
2  isp-gateway.net (10.0.0.1)  15.234 ms  14.567 ms  16.123 ms
3  * * *
4  backbone.provider.com (203.0.113.1)  45.678 ms  44.321 ms  46.789 ms
Response Time Analysis
Network performance guidelines from Cisco’s documentation suggest:
- Local network hops: <5ms
- ISP hops: 5-50ms
- Internet backbone: 50-150ms
- International routes: 150-300ms
Test Your Network Path Now
Want to see your network path in action? Use our embedded network analysis tool below to trace routes to popular destinations and understand how your data travels across the internet. <!– Network path analysis tool embed placeholder –>
[NETWORK PATH ANALYZER EMBED PLACEHOLDER]
Note: This tool combines traceroute functionality with visual network mapping to help you understand your connection path.
8 Powerful Ways to Use Traceroute Command
1. Identifying Network Bottlenecks
Track down slow network segments by analyzing response times:
traceroute slow-website.com
Look for sudden jumps in response times between hops to identify bottlenecks.
2. Troubleshooting Connection Timeouts
When ping fails, traceroute shows exactly where the failure occurs:
tracert unreachable-site.com
This helps distinguish between routing issues and destination problems.
3. Analyzing Geographic Network Paths
Understanding data routing for compliance and performance:
traceroute international-site.com
Particularly important for businesses with data sovereignty requirements, as explained in Cloudflare’s guide to network routing.
4. Detecting Network Routing Changes
Monitor how your ISP routes traffic over time:
traceroute -I target-server.com
Regular traceroute tests can reveal routing changes that affect performance.
5. Troubleshooting VPN Connections
Verify VPN tunnel routing and identify connection issues:
traceroute vpn-exit-server.com
Compare routes with and without VPN to ensure proper tunneling.
6. Network Security Analysis
Identify potential security risks in network paths:
traceroute suspicious-destination.com
Unusual routing patterns may indicate security concerns or hijacked routes.
7. ISP Performance Comparison
Compare different internet service providers:
traceroute test-server.com
Run from different ISP connections to compare routing efficiency.
8. Content Delivery Network (CDN) Analysis
Understand how CDNs route your traffic:
traceroute cdn-endpoint.com
Helps optimize content delivery strategies for web applications.
Advanced Traceroute Command Options
Windows Tracert Options
-d: Don’t resolve hostnames (faster execution)-h maximum_hops: Set maximum number of hops-w timeout: Set timeout for each reply-4: Force IPv4 usage-6: Force IPv6 usage
Example:
tracert -d -h 15 google.com
Linux/Mac Traceroute Options
-I: Use ICMP echo requests-T: Use TCP SYN packets-U: Use UDP packets (default)-p port: Specify destination port-m max_ttl: Maximum number of hops-w waittime: Time to wait for response
Example:
traceroute -I -m 20 google.com
Common Traceroute Command Issues and Solutions
Asterisks (*) in Output
Asterisks indicate that a router didn’t respond within the timeout period.
Possible causes:
- Router configured not to respond to traceroute
- High network congestion
- Firewall blocking ICMP packets
- Router overloaded
Solutions:
- Try different packet types (
-I,-T,-Uon Linux/Mac) - Increase timeout values
- Use alternative routes for comparison
Incomplete Traces
Traceroute stops before reaching destination.
Possible causes:
- Maximum hop limit reached
- Destination blocking traceroute packets
- Network routing loops
Solutions:
- Increase maximum hops limit
- Try different traceroute methods
- Verify destination is actually reachable with ping
Inconsistent Response Times
Large variations in response times between attempts.
Possible causes:
- Network congestion
- Load balancing across multiple paths
- Quality of Service (QoS) policies
Solutions:
- Run multiple traces at different times
- Consider network usage patterns
- Document patterns for trend analysis
Traceroute vs Other Network Tools
Traceroute vs Ping
- Ping: Tests end-to-end connectivity and latency
- Traceroute: Shows complete network path and per-hop performance
Traceroute vs MTR
MTR (My Traceroute) combines ping and traceroute functionality, providing continuous monitoring. According to Red Hat’s networking documentation, MTR is particularly useful for identifying intermittent network issues.
Traceroute vs Pathping
Windows Pathping combines traceroute with extended ping analysis, offering statistical data over time for each hop.
Best Practices for Using Traceroute Command
- Run multiple traces to identify consistent patterns vs anomalies
- Document baseline routes for comparison during troubleshooting
- Use appropriate packet types based on network policies
- Combine with other tools like ping and nslookup for comprehensive analysis
- Consider time of day when analyzing performance issues
- Respect network policies and avoid excessive testing that could impact performance
Interpreting Complex Traceroute Scenarios
Load Balancing Detection
When you see different IP addresses for the same hop number across multiple traces, this indicates load balancing:
3  load-balancer-1.isp.com (10.1.1.1)  25 ms
3  load-balancer-2.isp.com (10.1.1.2)  27 ms
3  load-balancer-3.isp.com (10.1.1.3)  24 ms
Routing Loops
Identical IP addresses appearing multiple times in sequence indicate routing loops – a serious network configuration issue.
Geographic Routing Analysis
Use hostname patterns and response time increases to identify geographic routing:
- Sudden latency jumps often indicate long-distance links
- Hostname patterns (like city codes) reveal geographic paths
Automating Traceroute Analysis
For network administrators managing multiple connections, automation tools can help:
Scripted Traceroute Monitoring
Create scheduled traceroute tests to monitor network path changes:
#!/bin/bash
traceroute google.com > /var/log/traceroute-$(date +%Y%m%d-%H%M).log
Integration with Monitoring Systems
Many network monitoring platforms integrate traceroute functionality for automated path analysis and alerting.
Frequently Asked Questions
Q: What’s the difference between tracert and traceroute? A: They’re the same tool with different names – Windows uses “tracert” while Unix-like systems (Linux, Mac) use “traceroute”.
Q: Why do some hops show asterisks (*)? A: Asterisks indicate that the router at that hop didn’t respond within the timeout period, often due to security policies or high load.
Q: Can traceroute show the exact physical location of routers? A: Not exactly, but hostname patterns and geographic routing can provide clues about general locations and network provider infrastructure.
Q: How long should I wait for traceroute to complete? A: Most traces complete within 30-60 seconds. If it takes longer, consider using timeout options or stopping the trace manually.
Q: Is it safe to run traceroute on production networks? A: Yes, traceroute is generally safe and generates minimal network traffic, but avoid excessive testing that could be mistaken for network reconnaissance.
Q: Why do traceroute paths sometimes change? A: Internet routing is dynamic – ISPs optimize paths based on network conditions, load balancing, and routing policies. The Internet Society explains how dynamic routing works in internet infrastructure.
Conclusion
The traceroute command is an essential tool for network professionals and anyone serious about understanding network connectivity. By revealing the complete path your data takes across networks, traceroute enables precise troubleshooting, performance analysis, and network optimization that goes far beyond basic connectivity testing.
Whether you’re troubleshooting slow connections, analyzing network security, or optimizing application performance, mastering the traceroute command will significantly enhance your network diagnostic capabilities. Remember to combine traceroute with other networking tools for comprehensive analysis and always document your findings for future reference.
Start incorporating traceroute into your regular network troubleshooting workflow, and you’ll quickly discover network issues that would otherwise remain hidden. For foundational network connectivity testing, make sure to also master our complete ping command guide to build a comprehensive troubleshooting toolkit.
Continue Your Network Troubleshooting Journey
Ready to expand your network diagnostic skills even further? Our upcoming guide on network monitoring and performance optimization will show you how to proactively identify and resolve network issues before they impact users.